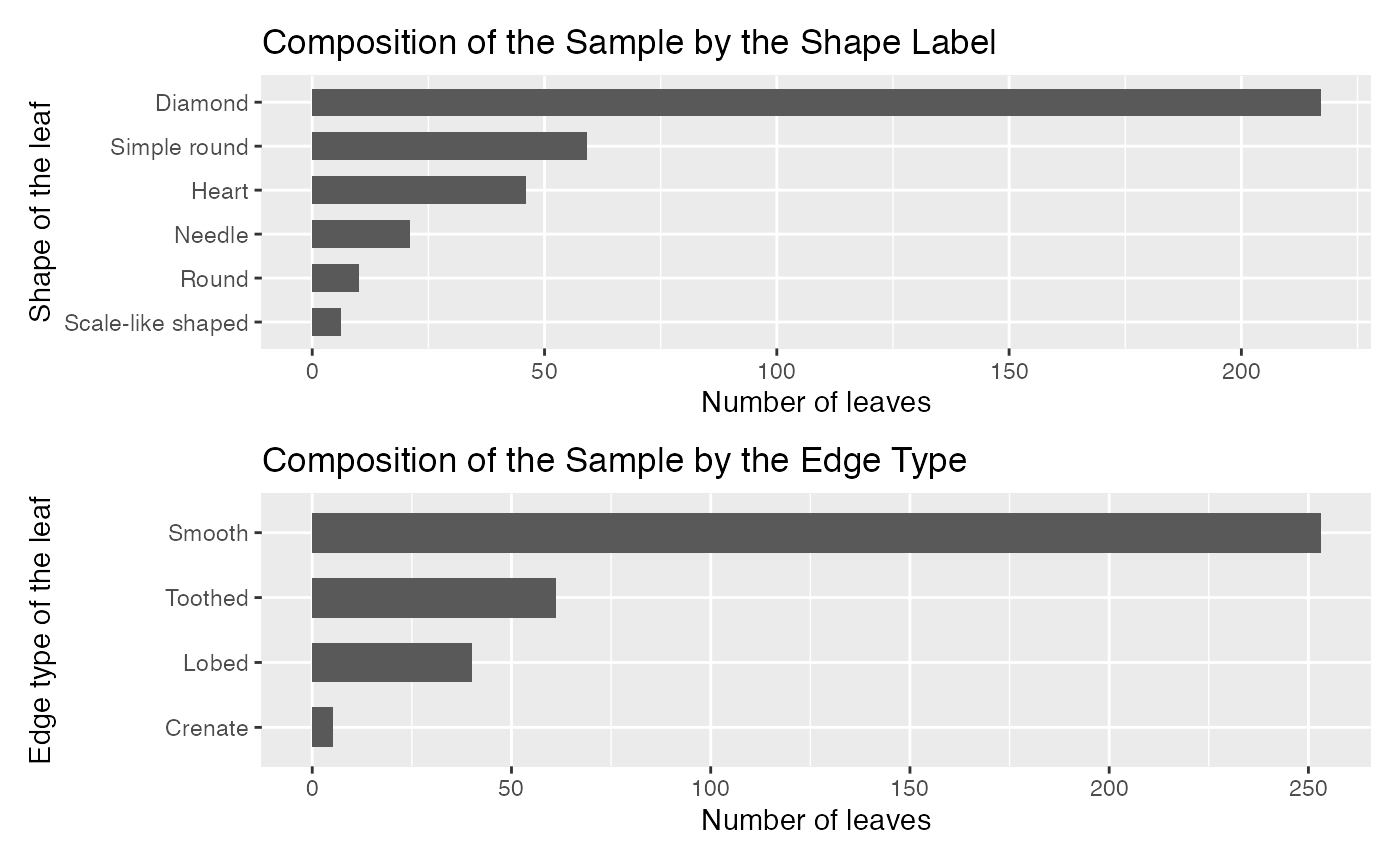
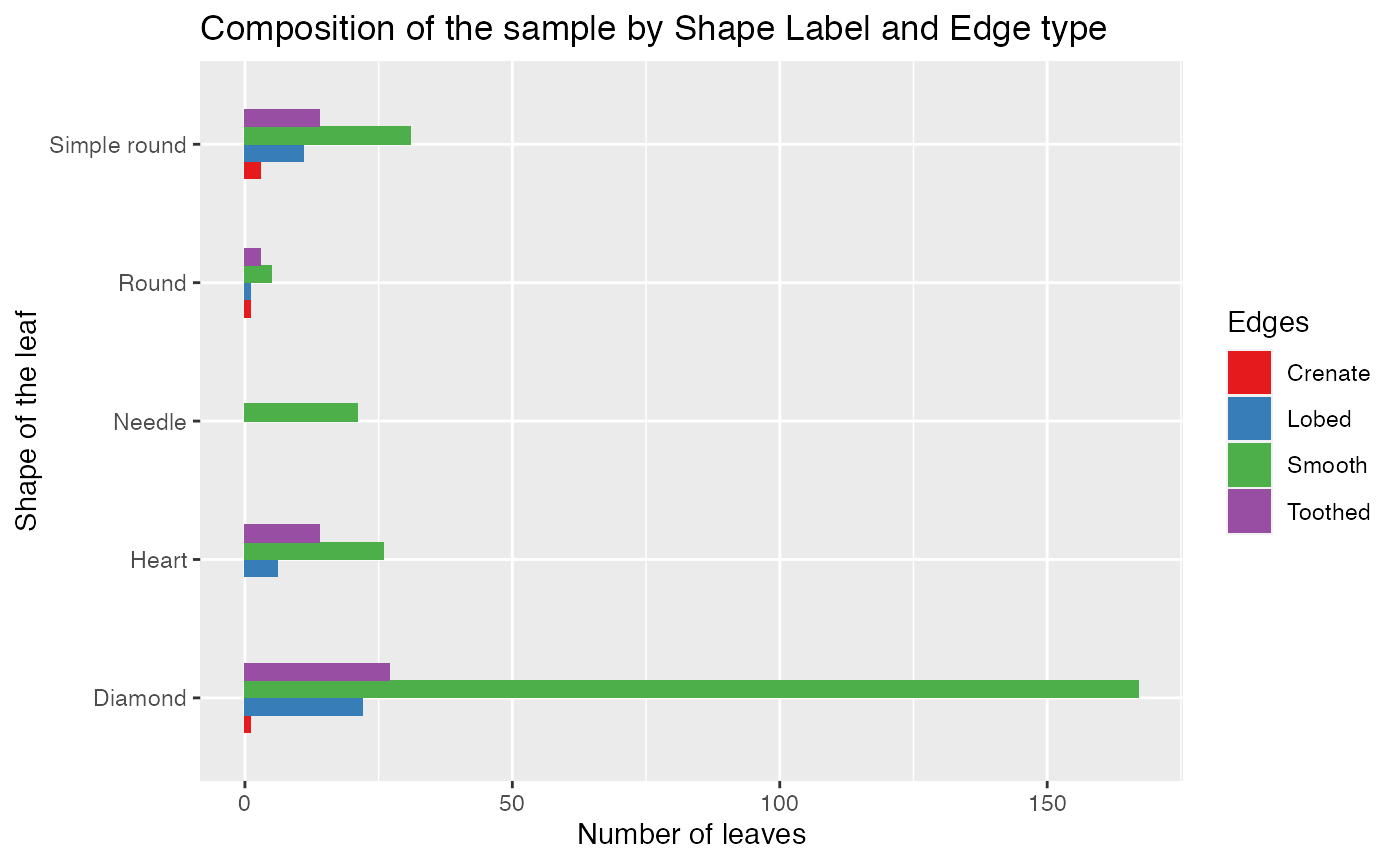
medlea <- filter(medlea, Arrangements == "Simple")

d11 <- as.data.frame(table(medlea$Shape))
names(d11) <- c('Shape_of_the_leaf', 'No_of_leaves')

p2 <- ggplot(d11, aes(x= reorder(Shape_of_the_leaf, No_of_leaves), y=No_of_leaves)) + labs(y="Number of leaves", x="Shape of the leaf") + geom_bar(stat = "identity", width = 0.6) + ggtitle("Composition of the Sample by the Shape Label") + coord_flip()
d11 <- as.data.frame(table(medlea$Edges))
names(d11) <- c('Edges', 'No_of_leaves')
#d11 <- d11 %>% mutate(Percentage = round(No_of_leaves*100/sum(No_of_leaves),0))
#ggplot(d11, aes(x= reorder(Shape_of_the_leaf, Percentage), y=Percentage)) + labs(y="Percentage", x="Shape of the leaf") + geom_bar(stat = "identity", width = 0.5) + geom_label(aes(label = paste0(Percentage, "%")), nudge_y = -3, size = 3.25, label.padding = unit(0.175,"lines")) + ggtitle("Composition of the Sample by the Shape Label") + coord_flip()

p3 <- ggplot(d11, aes(x= reorder(Edges, No_of_leaves), y=No_of_leaves)) + labs(y="Number of leaves", x="Edge type of the leaf") + geom_bar(stat = "identity", width = 0.6) + ggtitle("Composition of the Sample by the Edge Type") + coord_flip()

p2 + p3 + plot_layout(ncol = 1)

